
TL;DR – Clarity’s Lab Team is excited to release version 2.1 of our PM2.5 Global Calibration! v2.1 improves upon the powerful v2 PM2.5 Global Calibration by increasing accuracy during high-pollution events. In this blog post, we explain how we developed this new calibration and share performance metrics that show a significant improvement in sensor accuracy, especially during periods with elevated pollutant concentrations.
Background
Since the release of v1 of the PM2.5 Global Calibration in 2021, our partners have collocated hundreds of our Node-S devices with Federal Equivalent Method (FEM)-grade instruments worldwide. Initially developed to improve performance during wildfire smoke events in the United States, the v1 calibration has proven effective throughout the year and in regions without wildfire smoke.
Building on this success, we developed a v2 Global Calibration that leveraged a much larger dataset to enhance accuracy and representativeness even further. v2 proved very accurate in collocations all across the world; however, newly acquired data suggested that some improvements could be made in the upper range. With that in mind, Clarity’s Lab Team set out to explore opportunities for improvement that leverage the learnings of v2, and out of that work came v2.1.
Calibration Development
The Global Collocation Dataset
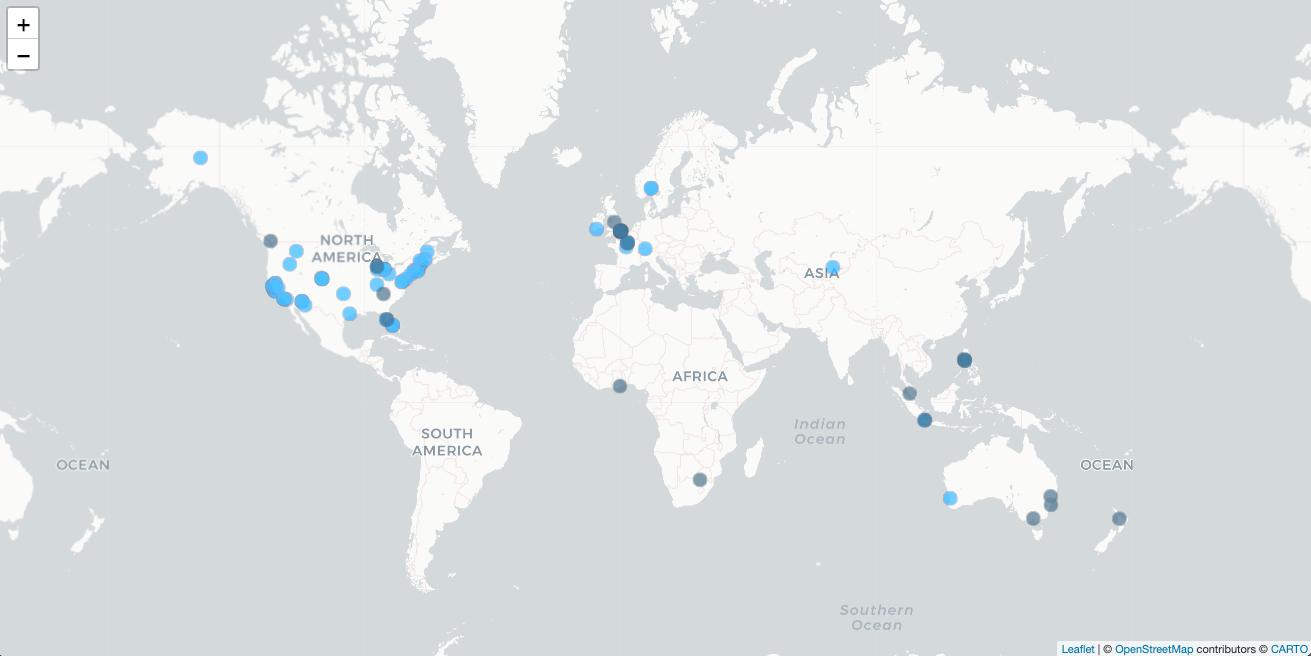
v2.1 was developed by evaluating many different models using a subset of the dataset of air quality measurements that was used to develop v2. This includes data from Clarity’s clients that have collocated hundreds of Node-S devices with FEM PM2.5 instruments globally. We carefully reviewed each collocation as part of a rigorous quality-control process, resulting in a dataset comprising 2.4 million hours of collocated Node-S and FEM data from:
- 84 different cities
- 623 nodes
- 98 reference sites
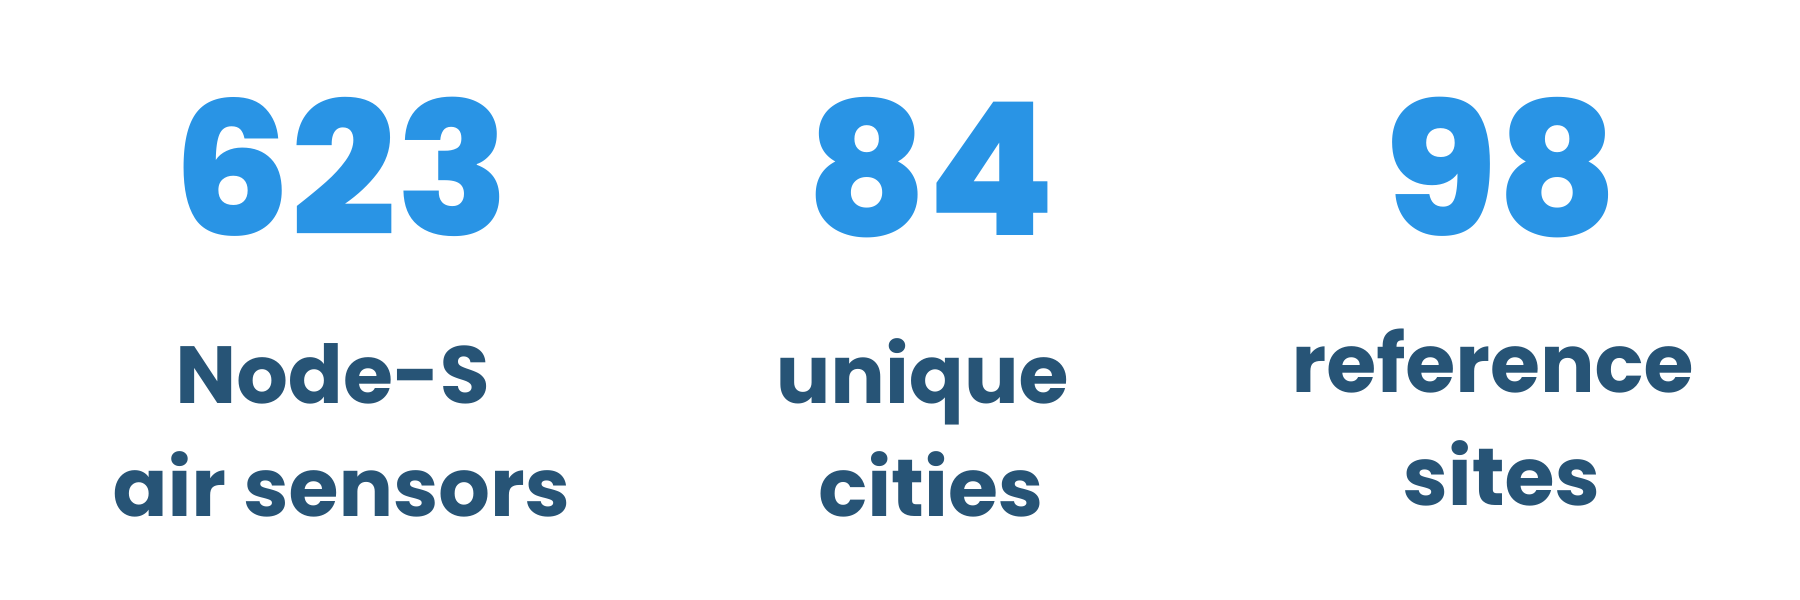
This dataset represents a 12-fold increase in the number of hourly measurements compared to the dataset used for v1!
Model Development
Our Lab employed Leave One (reference site) Out Cross-Validation to evaluate the performance of different modeling approaches. We tested various modeling techniques, including Gaussian Mixture Regression, Ensemble Forest Models, Neural Networks, and multiple linear regression. Additionally, we experimented with various derived features (e.g., dew point, interaction terms between different metrics).
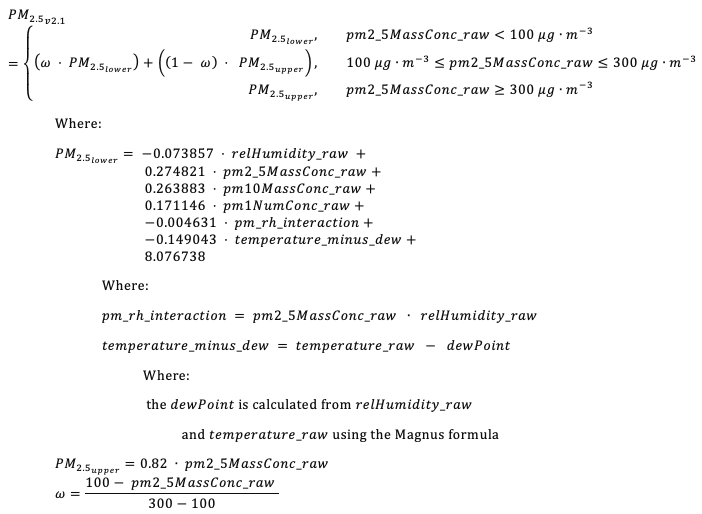
The Final v2.1 Calibration
After extensive experimentation, the Lab settled on a combination of the v2 multiple linear regression model that incorporates several features and a simpler linear correction that is used at higher concentrations. This model was chosen for its transparency, ability to extrapolate outside the training domain, and most importantly, its ability to enhance the accuracy of Clarity’s PM2.5 measurements worldwide.
The v2.1 Calibration follows a three-part structure:
- At low concentrations, it retains the v2 equation.
- At high concentrations, it applies a new linear correction.
- In the transition region, it linearly interpolates between the two equations.
The model combines features measured directly by the Node-S with features derived from mathematical combinations of these measurements. Notably, no external data (e.g., land use, traffic, air pollution models, or satellite data) are used.
The uncorrected PM2.5 mass concentration output from the Plantower sensor correlates well with gravimetric instruments under stable environmental conditions and consistent particle composition, but is affected by changes in these factors. To address this, the calibration model includes:
- Two additional outputs from the PM sensor for size-resolved particle mass and number concentration. These outputs help detect changes in particle size distribution, addressing variability in particle composition.
- Three terms related to environmental conditions. These terms account for the uptake of water by particles, which can alter particle sizes and optical properties, addressing the impact of changing environmental conditions.
The features are:
After training the model on our Global Collocation dataset, the form of the calibration is:
How Well Does v2.1 Perform?
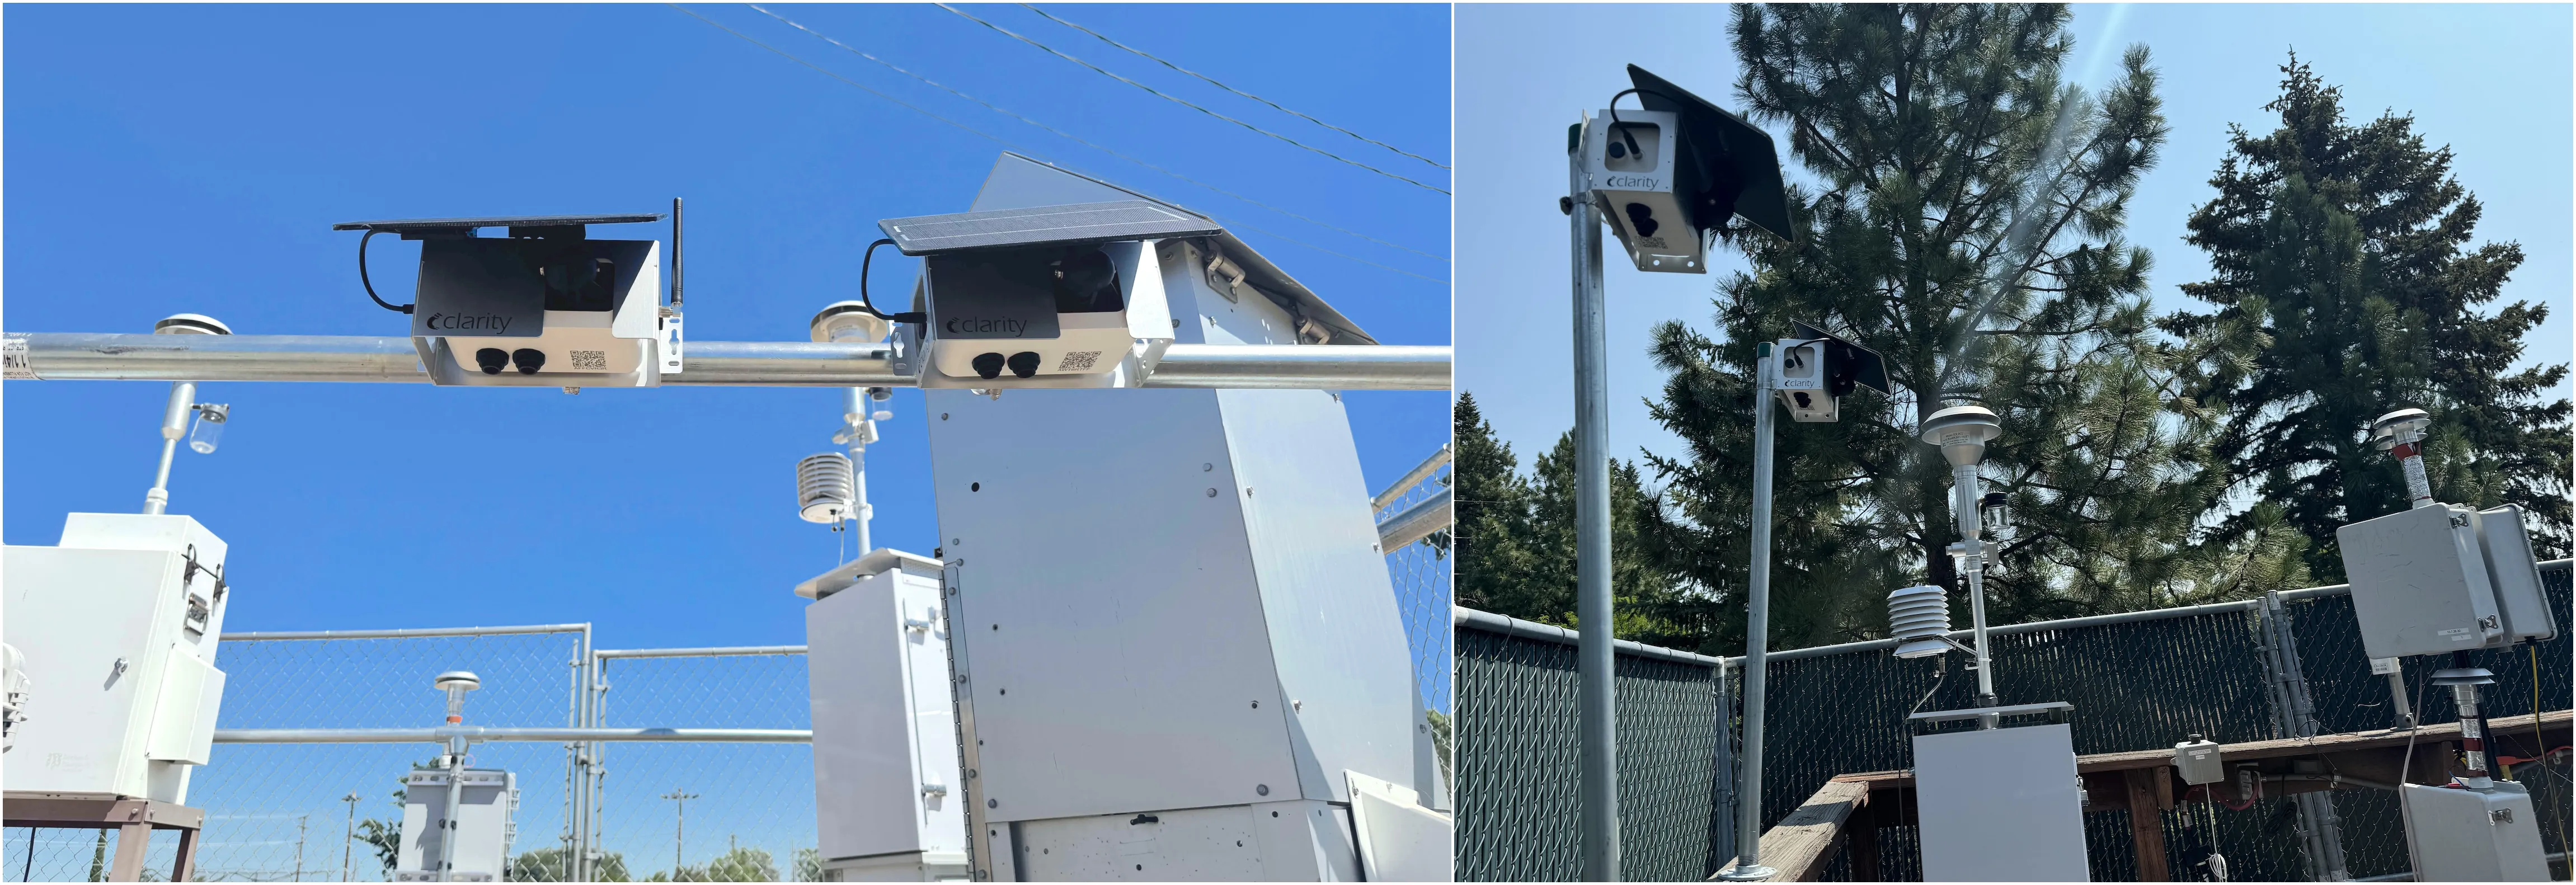
During 2024, Clarity worked with partners at air quality monitoring agencies to deploy Node-S devices at monitoring sites across the Western United States in locations that were likely to experience elevated PM2.5 concentrations.
The primary goal of these collocations was to provide a robust dataset that could be used to support Clarity’s application for inclusion on the AirNow Fire and Smoke Map, but it also provided an excellent opportunity to evaluate v2.1 on a dataset that was not used in the development of v2 or v2.1. Because v2.1 leverages v2 for lower-concentration measurements and then gradually transitions to the upper-range adjustment, the vast majority of measurements are equal or only slightly different.
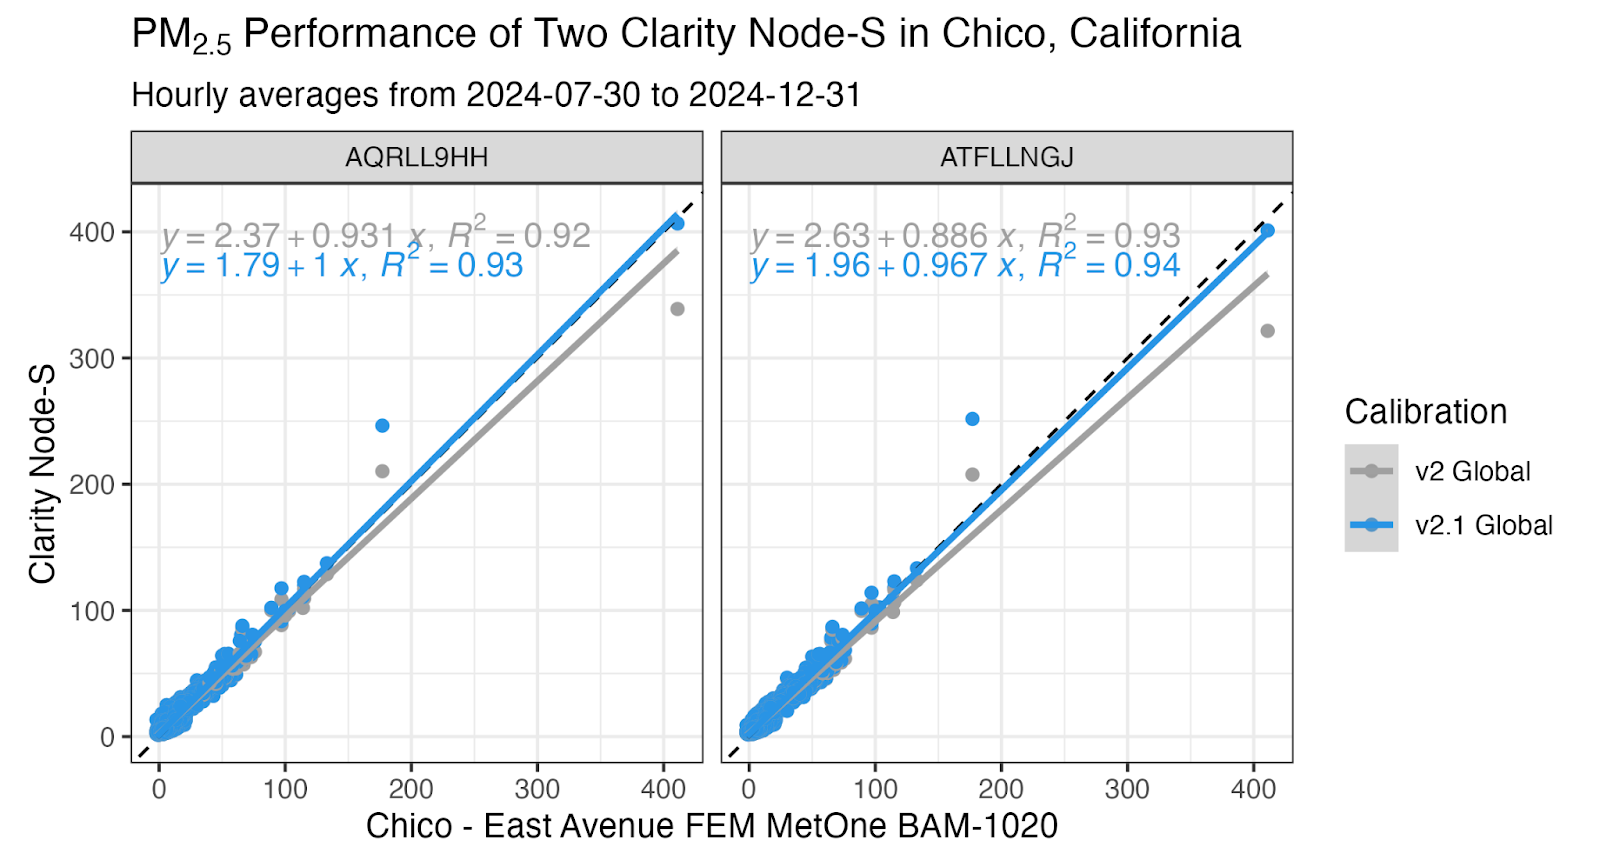
This is demonstrated by taking a look at one of the aforementioned collocations: two Clarity Node-S at a site managed by the California Air Resources Board in Chico, California (Figure 2). The v2 performance is already stellar, and v2.1 improves the performance statistics slightly, but the biggest improvement is in the accuracy above 100 μg/m³.
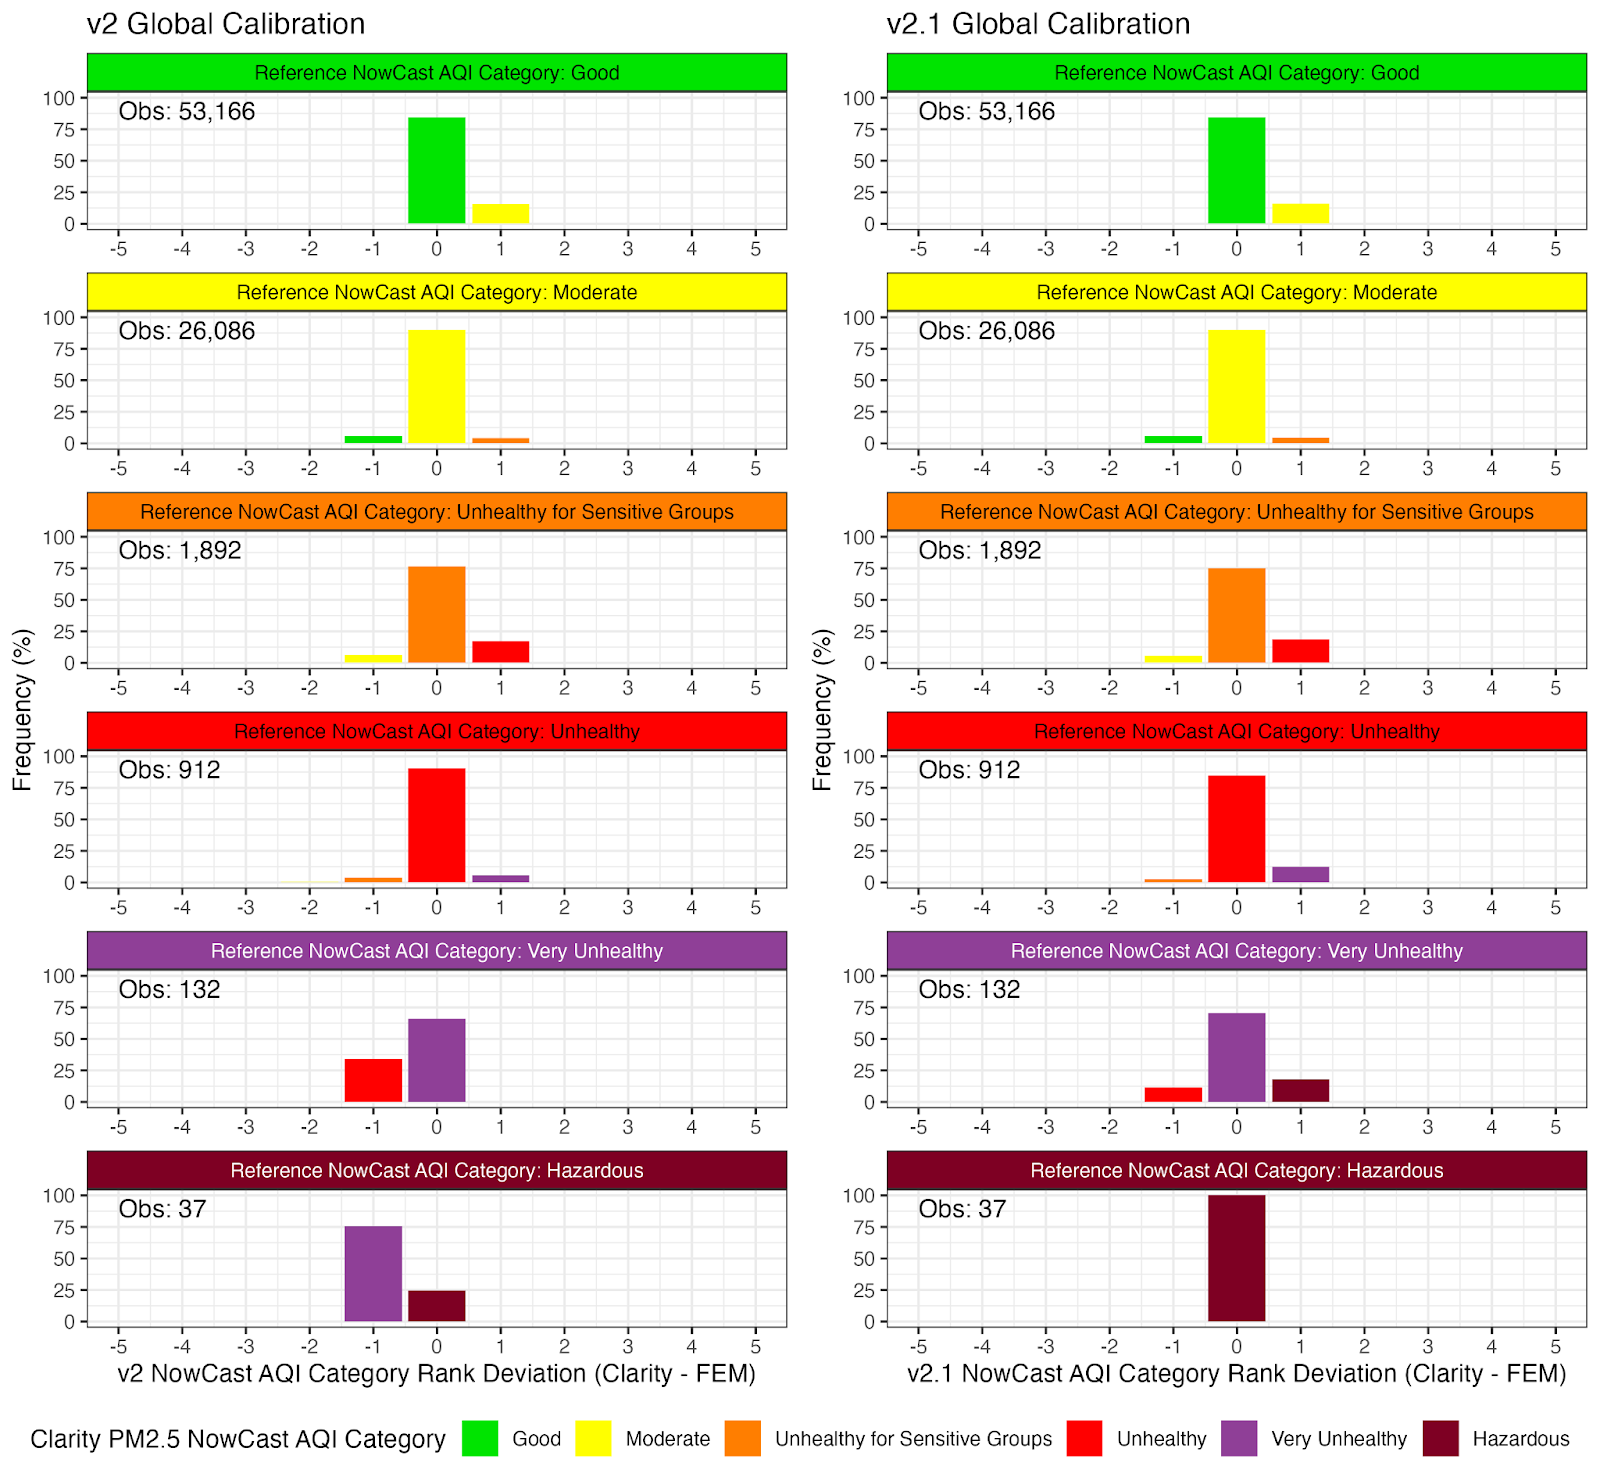
To better understand how this performance improvement plays out when communicating real-time measurements to the public, we calculated NowCast AQI for the entire dataset using both v2 and v2.1 (Figure 3). This analysis shows the nearly identical performance of v2.1 compared to v2 up to the Very Unhealthy category, at which point the v2.1 model reduces miscategorization compared to v2.
Awesome! So How Can We Use It?
If you are currently using the v2 Global calibration profile for PM2.5, your devices will automatically be upgraded to v2.1 on May 1st, 2025. If you would like to transition to v2.1 sooner, or switch from a custom calibration to the v2.1 Global Calibration Profile, please contact support@clarity.io.